What is "predicted data"?
In machine learning, "predicted data" are often thought of as the outputs from
a complicated algorithm. I opt for an even broader definition:
any
measure of a conceptual variable where a better, more direct measure exists.
This definition includes predictions from black-box AI models like chatGPT, but also includes other
data we rely upon as social scientists, like survey responses, interviews, imputations, statistical estimates, derived measures,
and a whole host of other proxies. Below is a table with some examples I have come across in my own research.
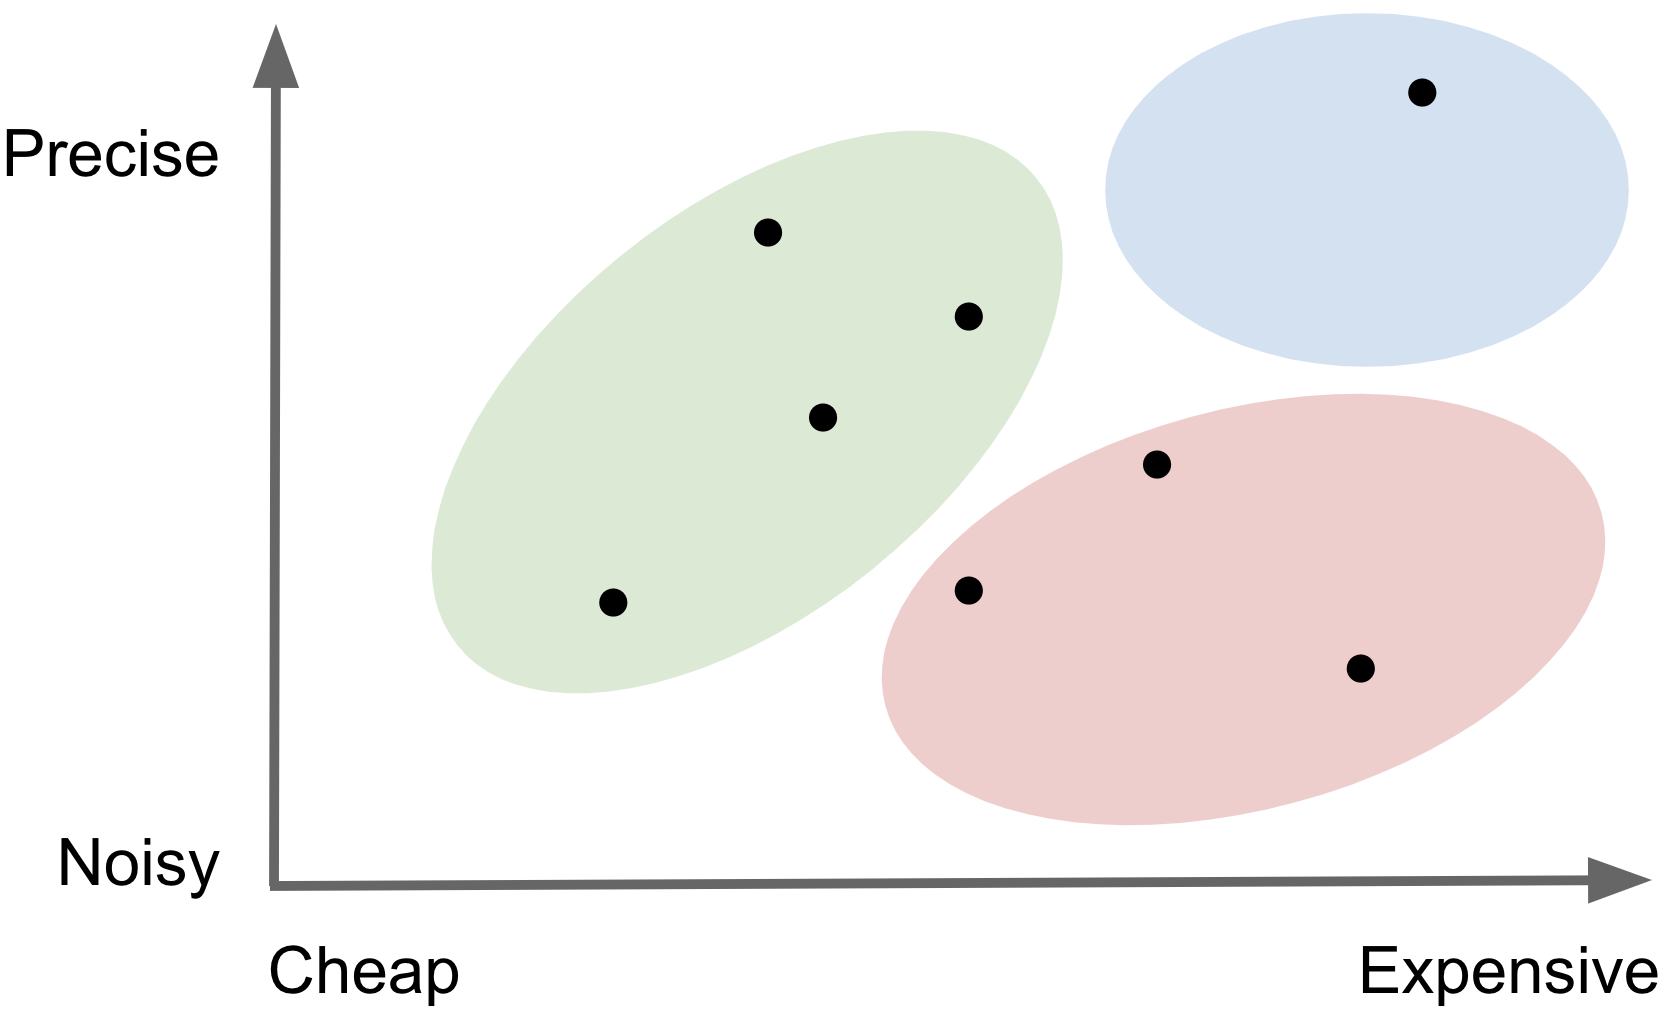
Every conceptual variable comes with different measurement challenges, but in general, more precise
measurements are also more expensive to collect. A stylized image below shows that
expensive and precise
ground truth measures tend to live in the light blue region, with predicted data everywhere else. Because of this cost-quality tradeoff,
we often resort to working with predicted data in practice. But not all predicted data
are created equally! The best are those depicted in the green region - relatively
precise and cheap compared
to the red region -
noisy and expensive.
Predicted vs Ground Truth Data
Measurements vary in both cost and precision
| Variable |
Ground Truth |
Predicted |
| Cause of Death |
Vital Registration |
Verbal Autopsy |
| Obesity |
Fat Percentage |
BMI |
| Income |
Admin Data |
Self Reported |
| Environmental Attitude |
Questionnaire |
NLP Sentiment |
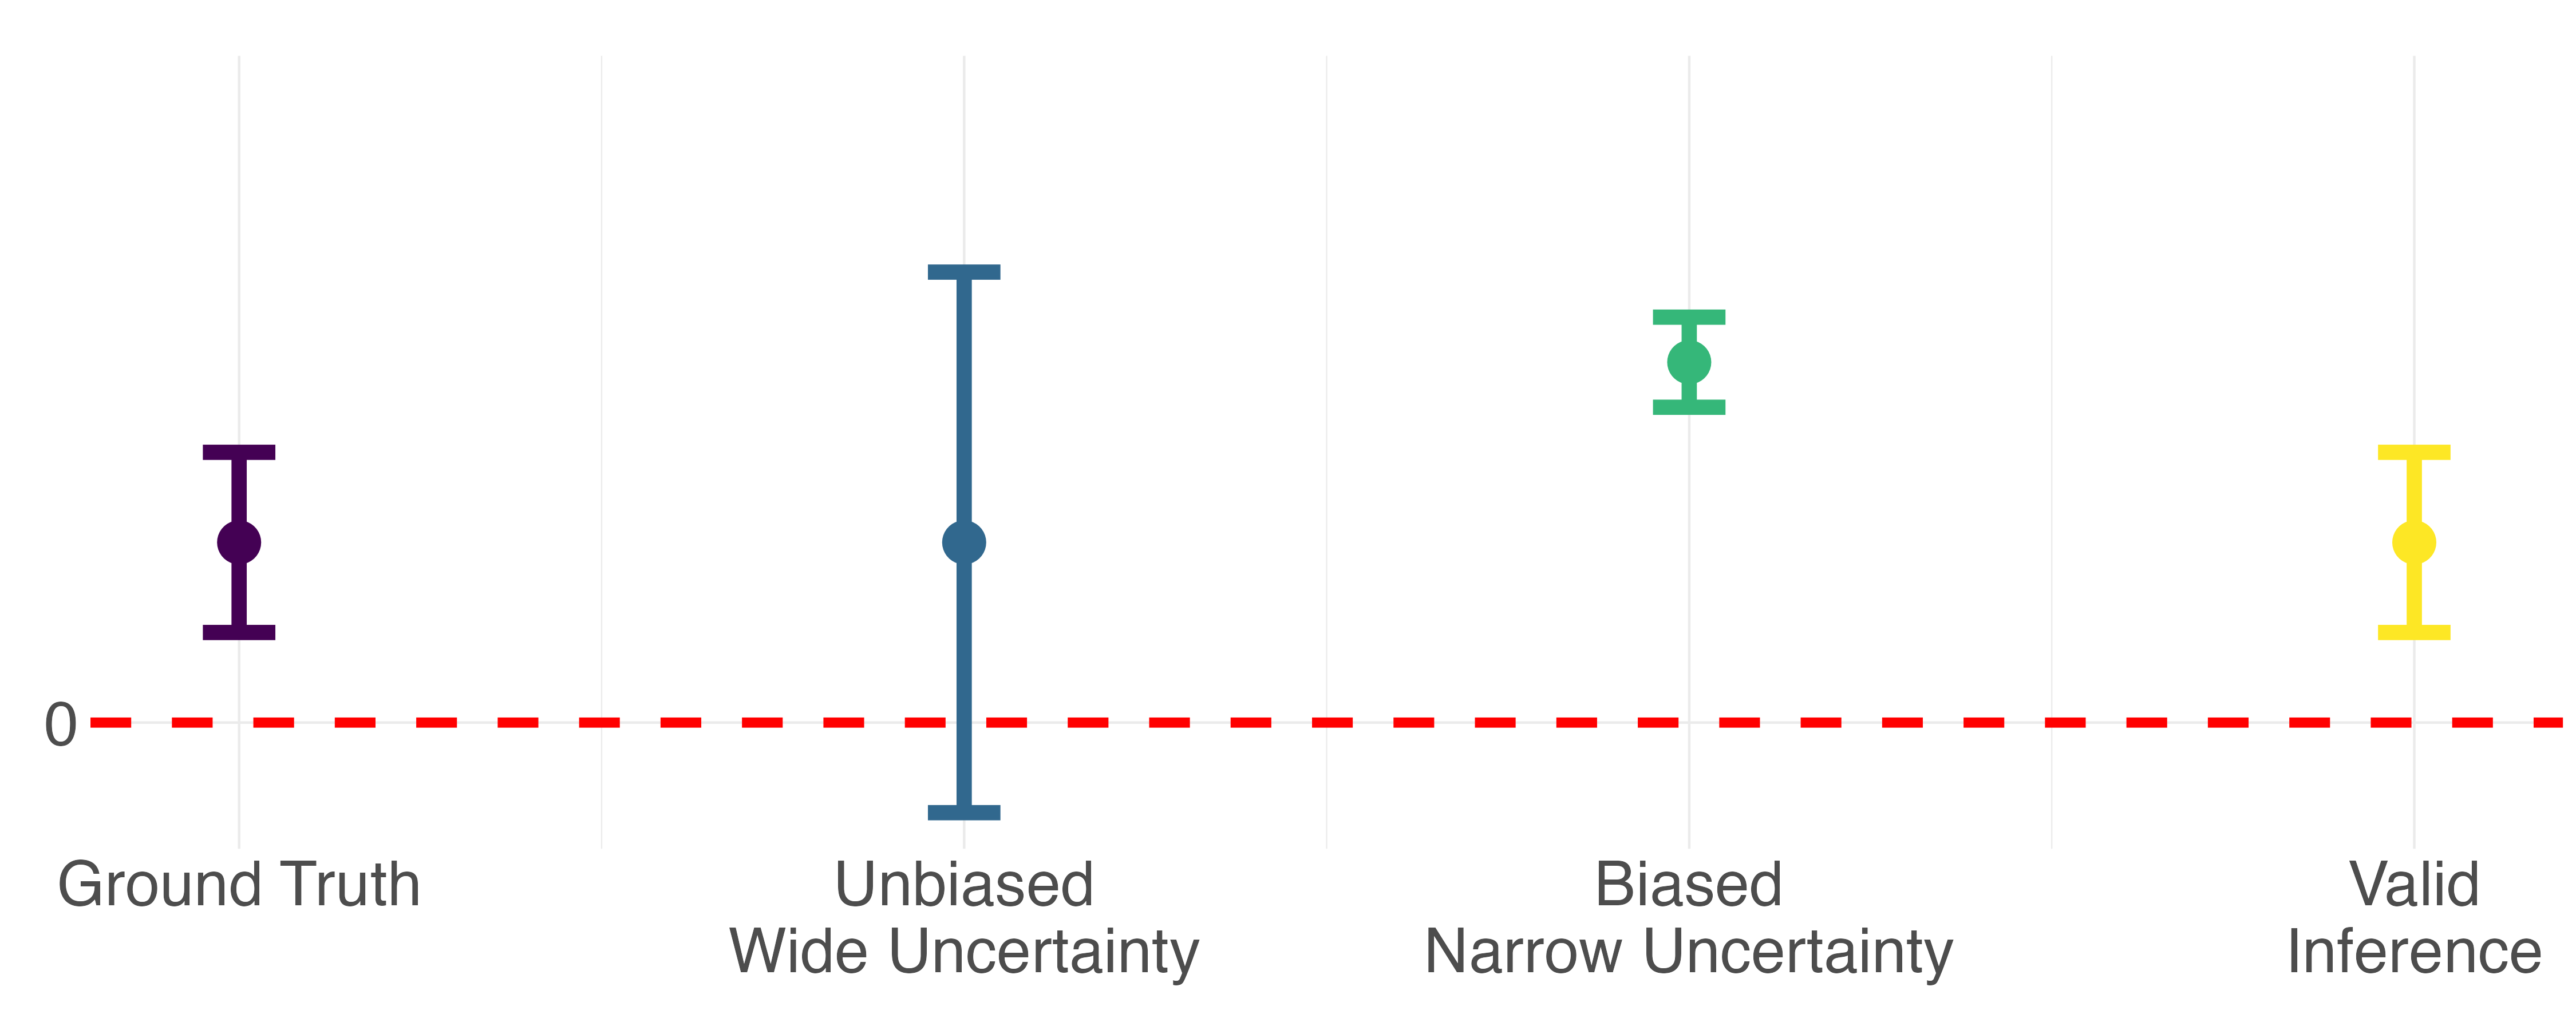
What does it mean for inference on predicted data to be invalid?
In this context, valid statistical inference refers to both
un-biased point estimates and
precise uncertainty bounds. Relative to inference performed with "ground truth"
outcomes, inference on predicted data may have biased point estimates due to systematic
differences between predictions and the ground truth, and the reported uncertainty will be
deceivingly narrow because it doesn't account for any of the prediction error.
Why does this matter? Consider a very simple hypothesis test where the p-value tells us whether
or not an observed relationship between X and y is statistically significant. This conclusion is
a function of both the point estimate and the uncertainty around that point estimate. The stylized
diagram below demonstrates how bias and conservative uncertainty might lead to very different
scientific conclusions.
Inference can have bias and/or misleading uncertainty
So how do you perform valid inference on predicted data?
There are several existing methods for performing the bias correction for valid inference
with predicted data. While the technical details differ, these methods are built upon the same intuition.
At its simplest, you incorporate what you learn when you have access to both ground truth and predicted
outcomes into downstream inference where you rely solely on predicted outcomes.
The two step procedure looks like this:
- Using side-by-side ground truth and predicted measures of the outcome variable, estimate
the IPD rectifier, Δ. This tells you how differences between Y and Ŷ are
associated with covariates X for the same observation.
(Yi - Ŷi) = ΔXi
- Now, when you perform inference with predicted outcomes in the absence of ground truth
measured outcomes, you incorporate the rectifier Δ into the naive parameters you estimate to
recover valid IPD estimates.
Invalid IPD → Ŷ2 = θX2
Correct IPD → Ŷ2 = (θ+Δ;)X2
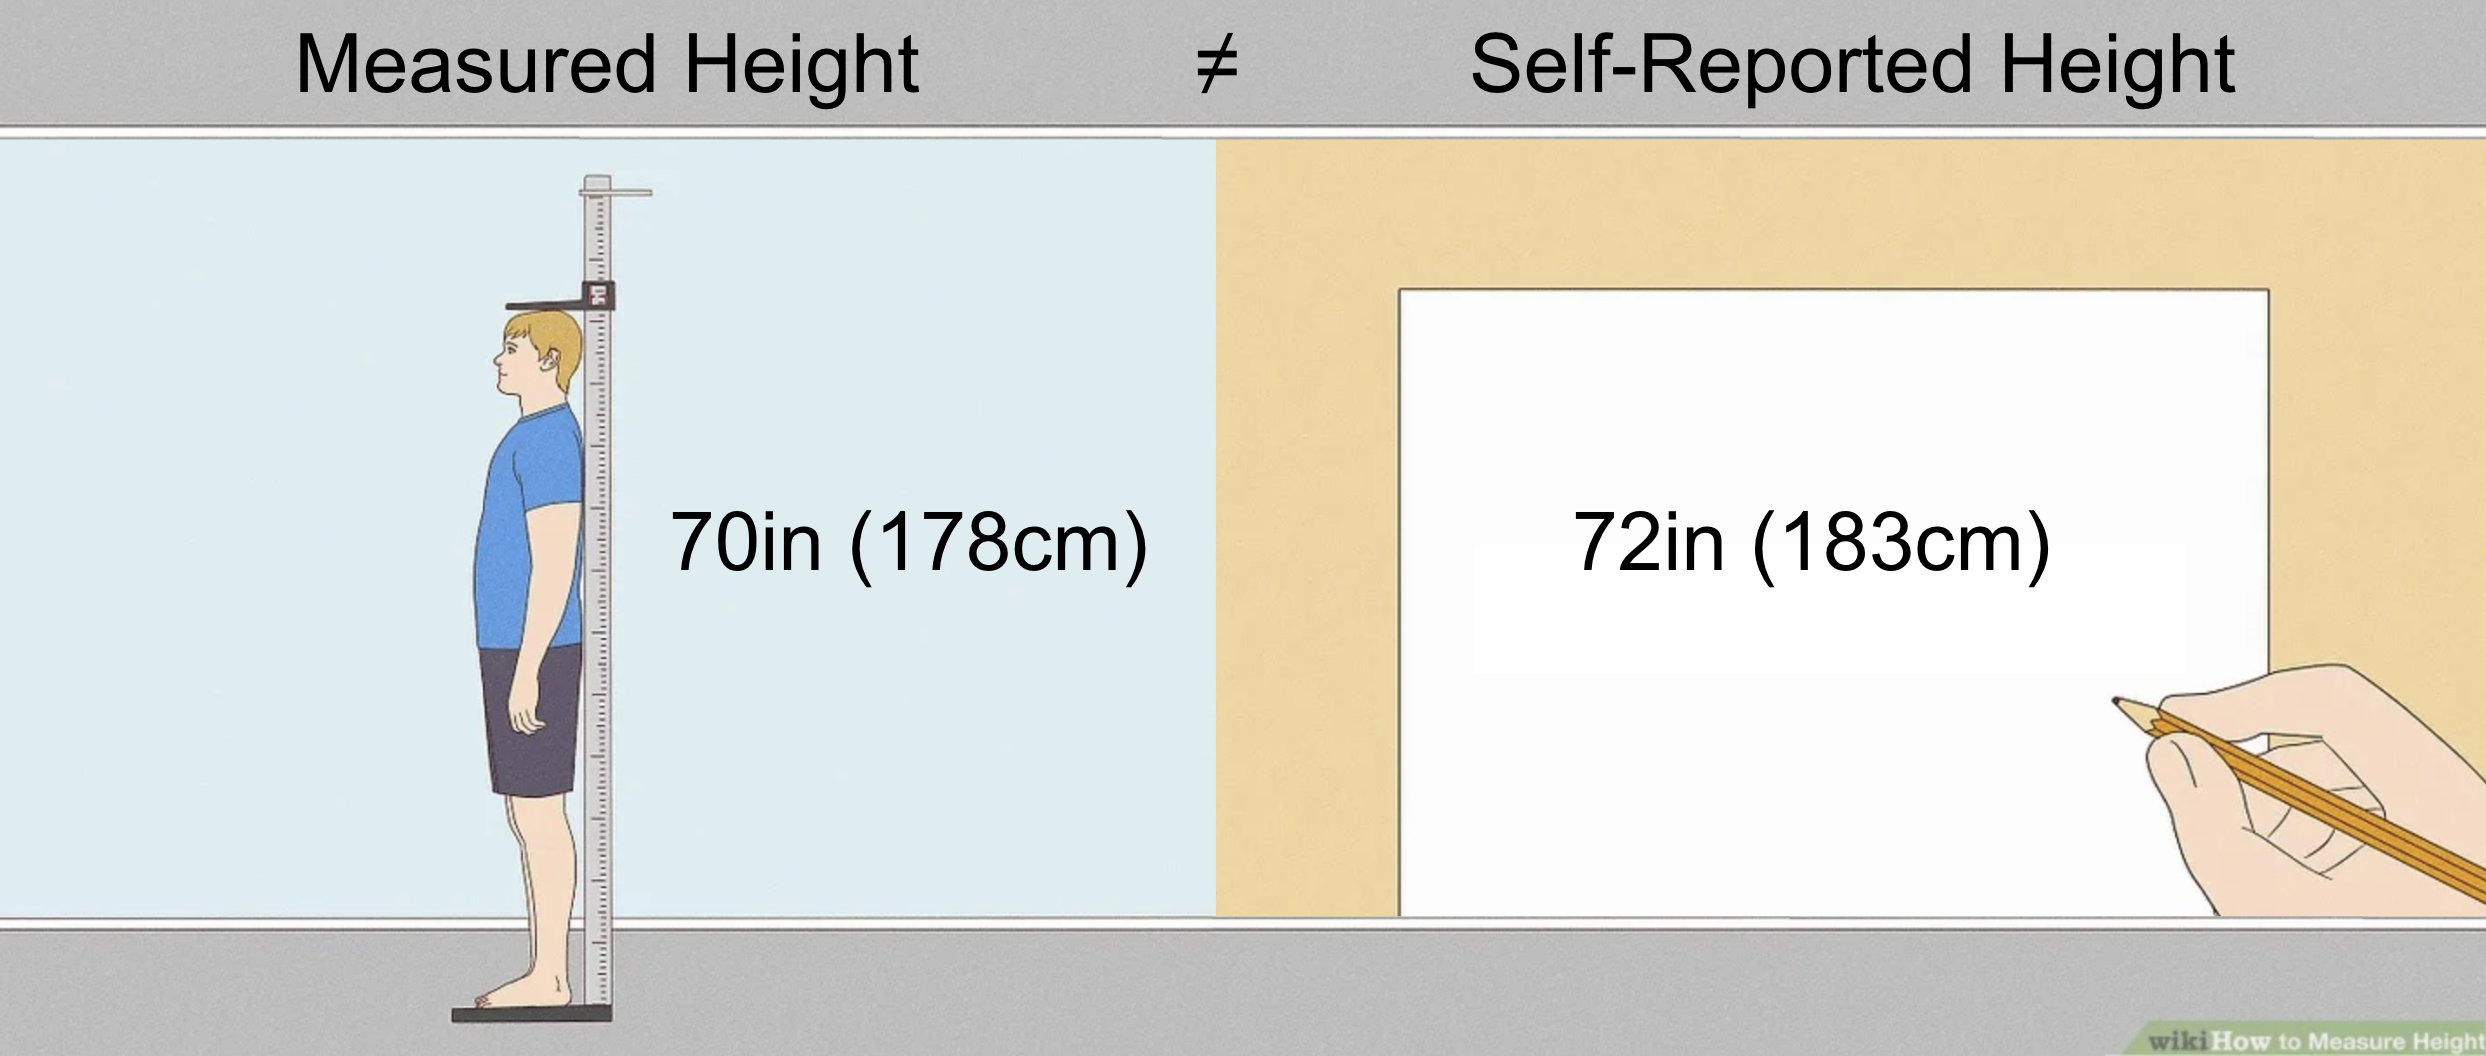
Cartoon example: height and basketball ability
We are interested in the association between a person's height and an index of their
basketball ability on a scale from 1-10. Height can be measured directly,
or from a self-report. Some people might report correctly,
others might not, so we consider the self-reported height
predicted data
relative to directly measured height as
ground truth data.
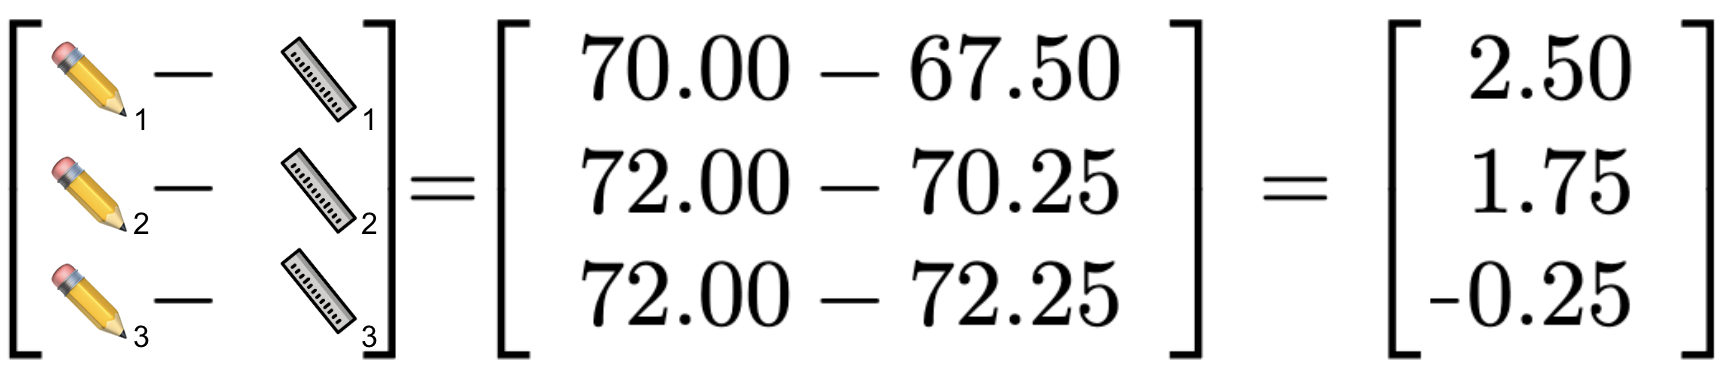
Oops! It looks like some people report being a couple inches taller than they actually are...
How does this affect our conclusion about the association between height and basketball ability when
we are relying on mostly self-reported height outcomes? Let's see. This is what it looks like to learn the
rectifier Δ from the labeled data to correct inference performed on the
unlabeled data.
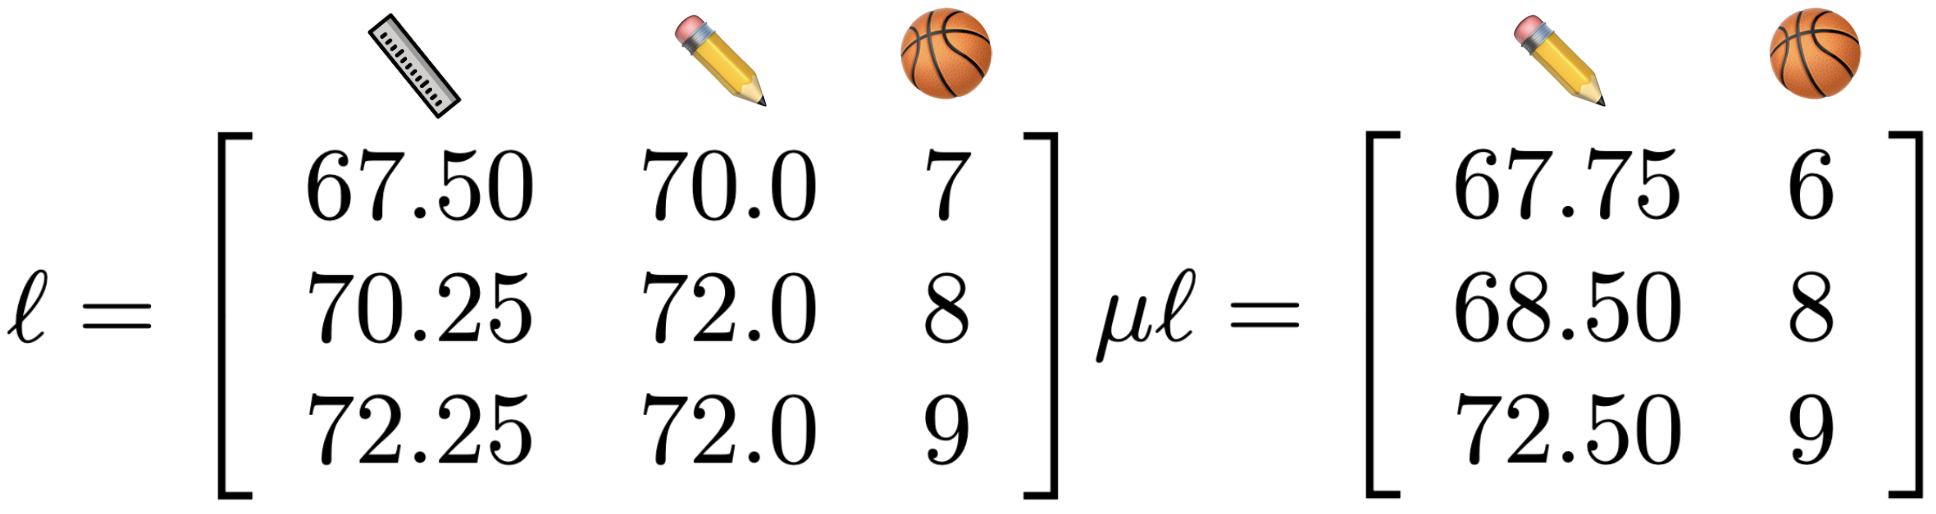
First, we have some labeled data, ℓ, with observed basketball ability 🏀,
with both measured height 📏 and self-reported height ✏️. We also have some unlabeled data,
μℓ, with observed basketball ability 🏀 and only self-reported height ✏️.
For the labeled data
ℓ, we can specify the relationship, β, between
height {measured:📏:y
m} or {reported:✏️:y
r} and basketball ability {🏀:X
ℓ}
with the following equations:
y📏 = β📏 🏀ℓ or ym = βmXℓ
y✏️ = β✏️🏀ℓ or yr = βrXℓ
solution for β
m written as β
m = (X
ℓTX
ℓ)
-1X
ℓTy
m
solution for β
r written as β
r = (X
ℓTX
ℓ)
-1X
ℓTy
r
and residuals of reported height y
✏️ and measured height y
📏
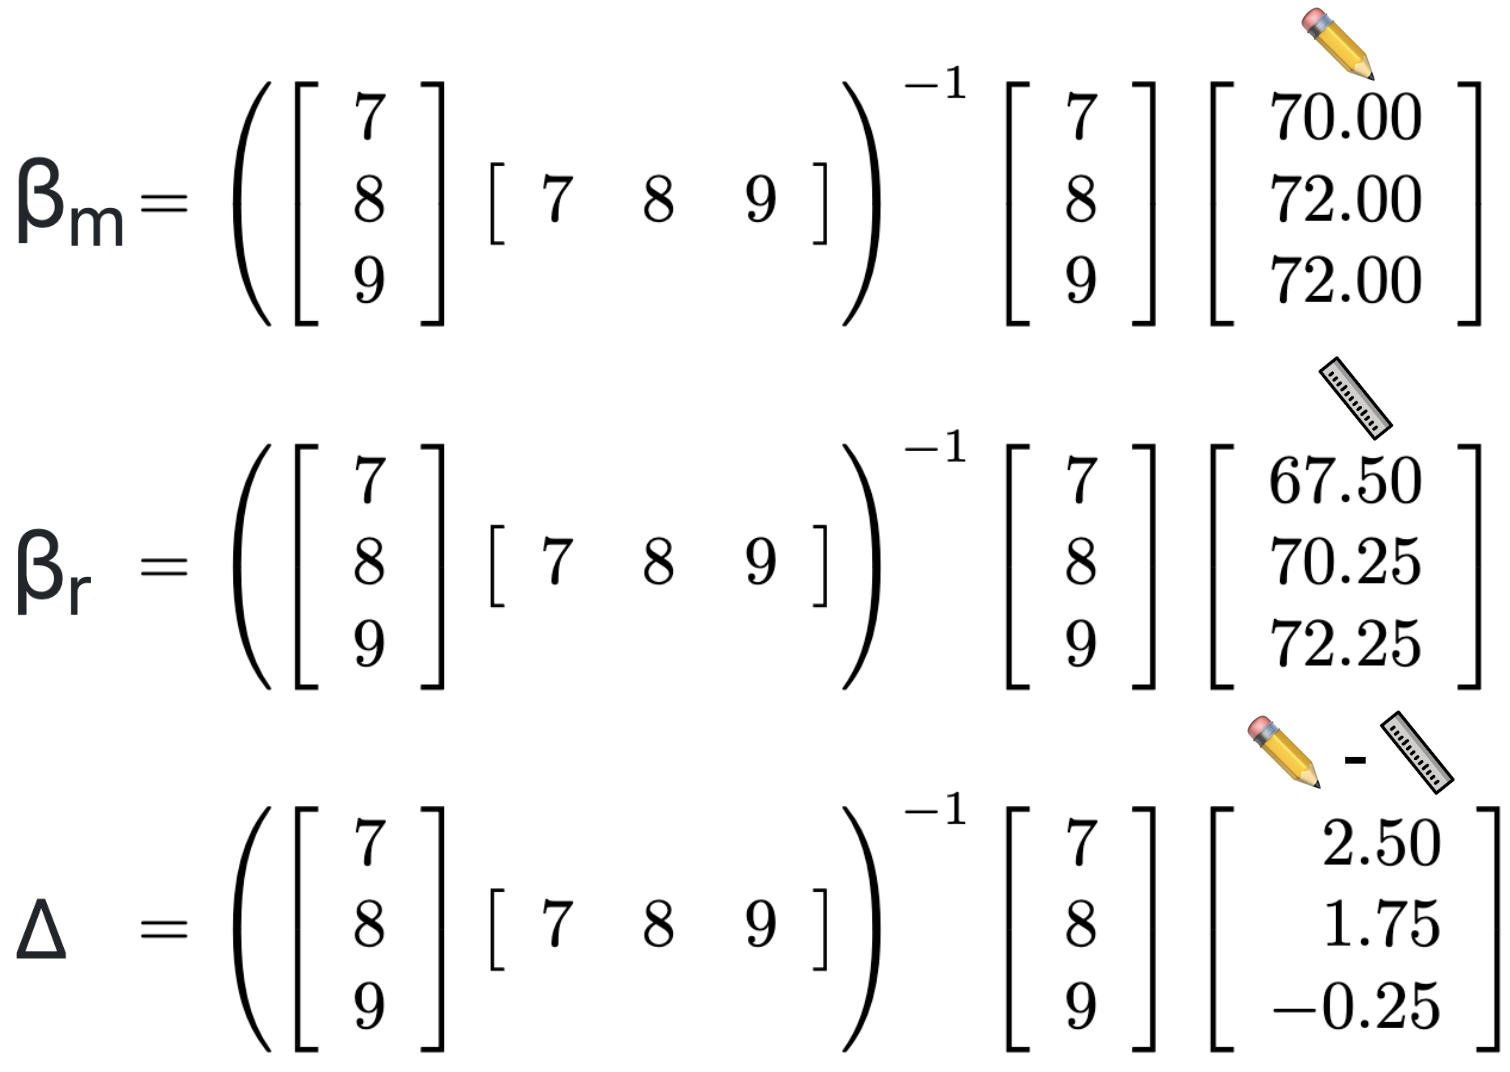
After matrix multiplication, rectifier Δ works out to
-1.375.
To recover the IPD corrected estimate β
IPD from the
unlabeled data
μℓ, we first estimate β
r from y
r =
β
rX
μℓ just like above. We find that
μℓ β
r is
1.41. Then,
we subtract the rectifier Δ from β
r
to find β
IPD. This gives
βIPD = βr - Δ
1.41 - (-1.375) = 2.78
βIPD = 2.78
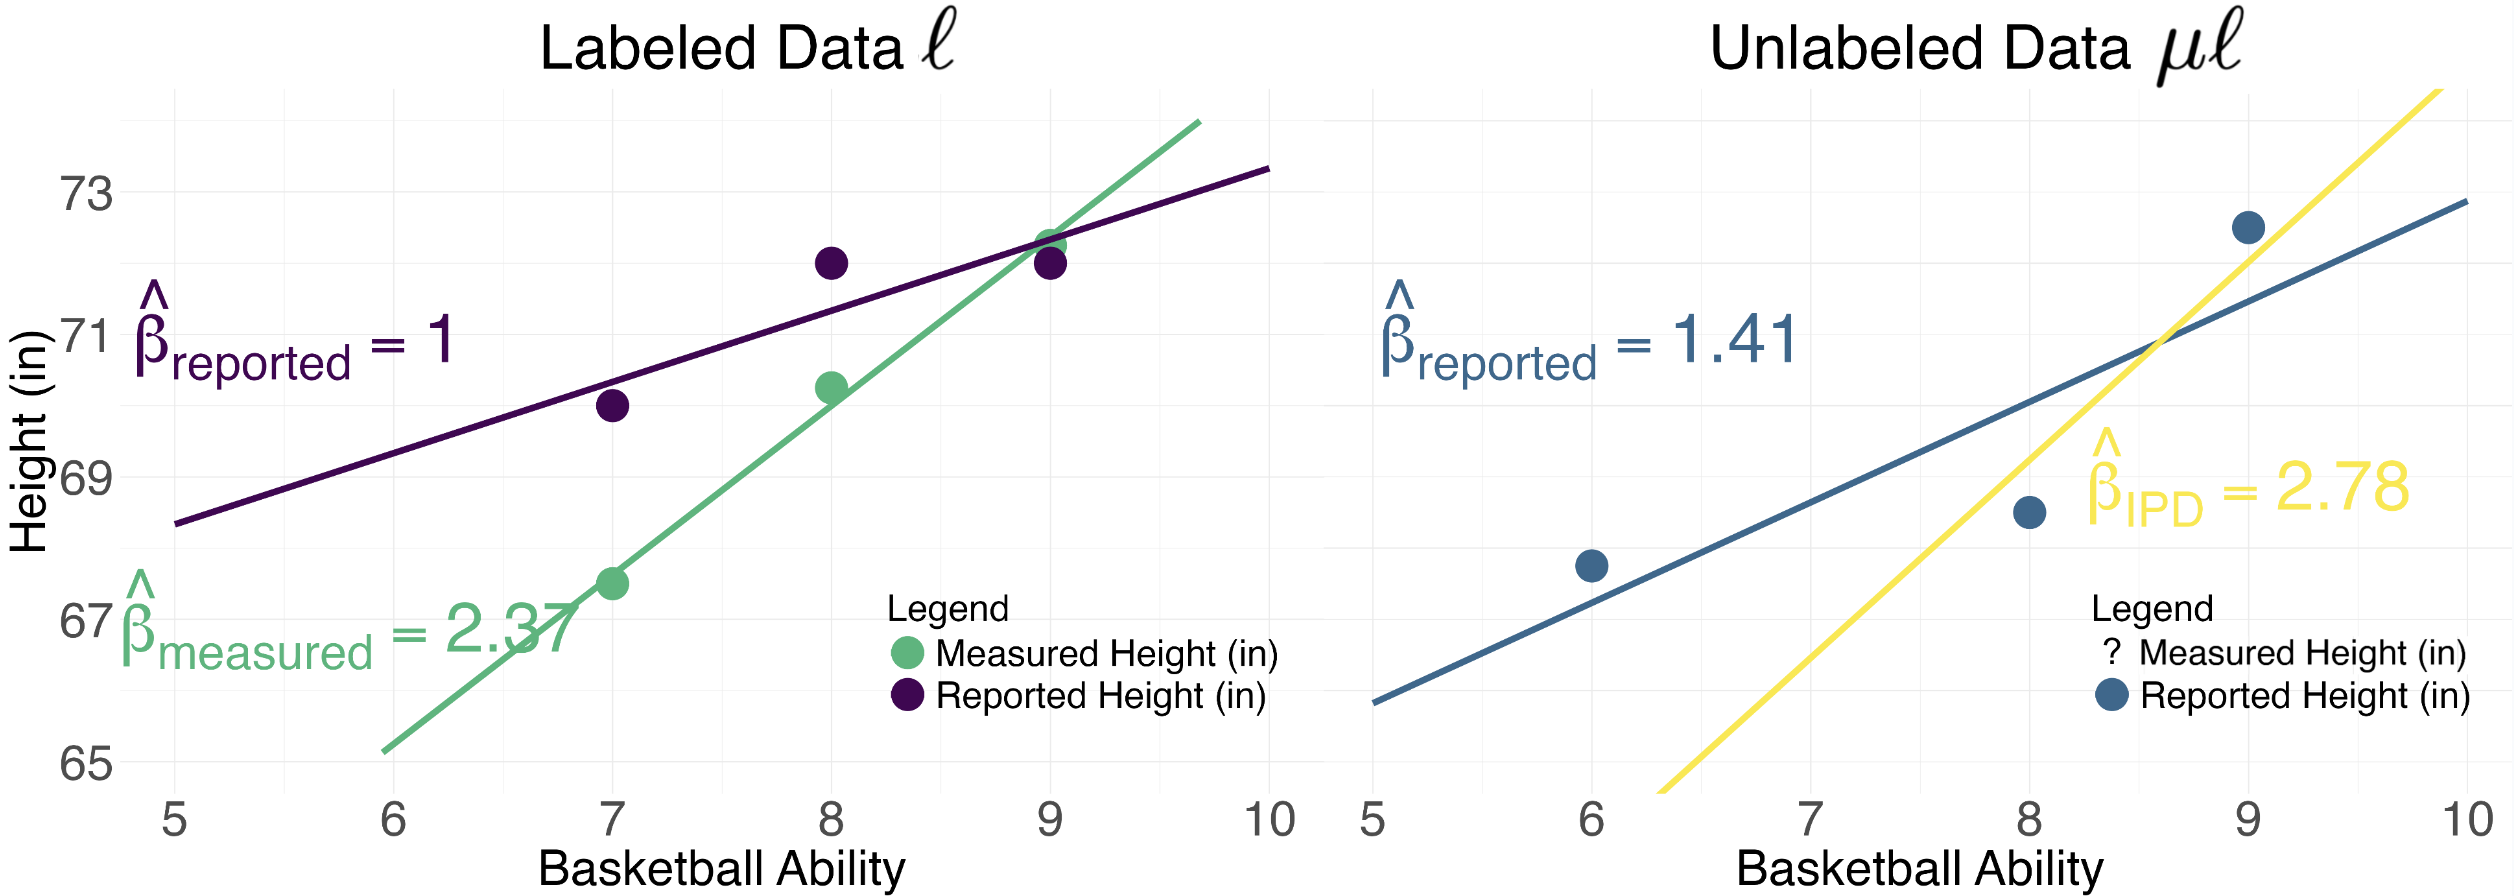
Below, you can see how the estimated relationships (
ℓ β
r,
ℓ β
m,
μℓ β
r,
μℓ β
IPD) compare to eachother.
In the labeled data
ℓ, we see that the ground truth relationship
between basketball ability and directly measured height is β
m=2.37. Because some
people self-reported being taller than they actually are, the estimated relationship is much weaker, with
β
r=1. Moving to the unlabeled data
μℓ, we see that the naive estimate of the
relationship between self-reported height and basketball ability is similarly weak, with β
r = 1.41.
Leveraging the relationship between directly measured height 📏 and self-reported height ✏️
in the labeled dataset
ℓ enables us to produce a valid estimate β
IPD in the unlabeled dataset
μℓ.
β
IPD = 2.78 is much closer to the ground truth β
m=2.37, and we arrive at this
conclusion
even in the absense of ground truth measures in the unlabeled dataset
μℓ.
The magnitude of the ground truth relationship between height and basketball ability is much larger than we would
conclude from inference on predicted data. For more discussion about how IPD correction can alter your
scientific conclusions, check out
Section 4.3 from my 2024 paper
From Narratives to Numbers: Valid Inference Using Language Model Predictions from Verbal Autopsies.
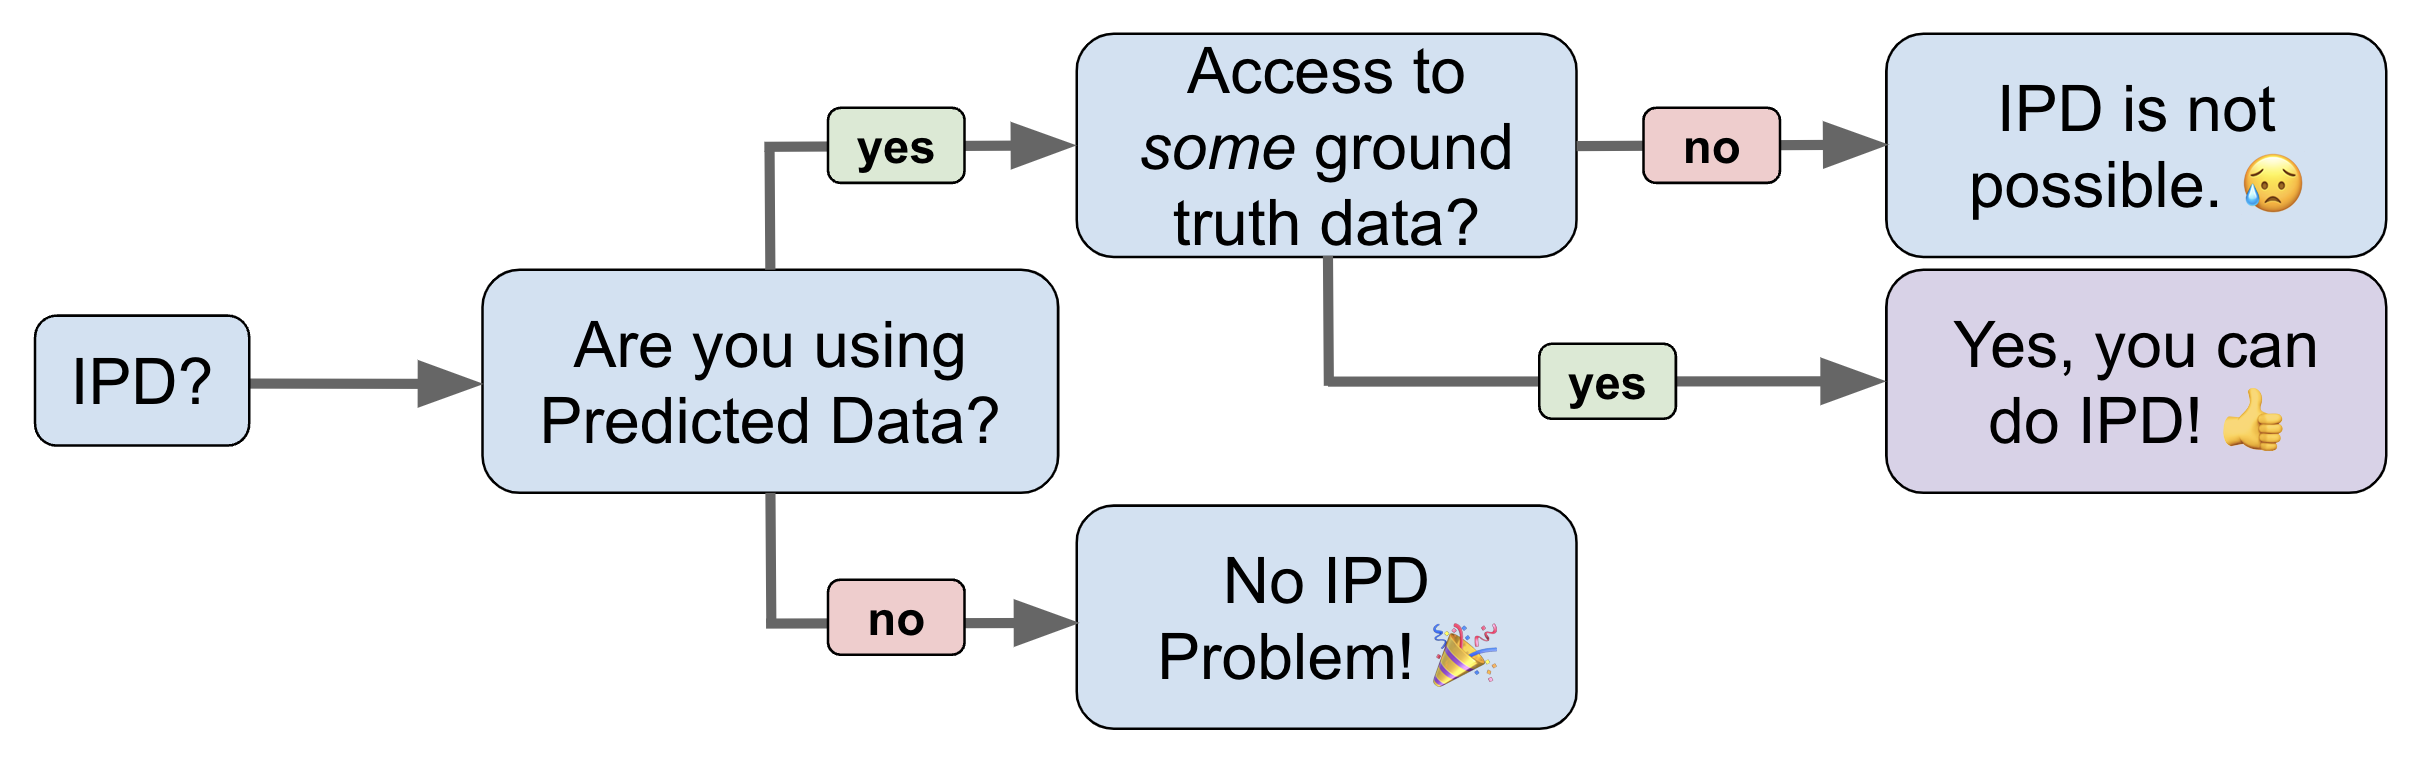
How to determine if IPD correction makes sense for your problem:
IPD References
(in reverse order of publication date)
-
Methods for correcting inference based on outcomes predicted by machine learning. (PostPI)
Wang, McCormick and Leek. 2020 PNAS.
-
Prediction-powered inference. (PPI)
Angelopoulos, Bates, Fannjiang, Jordan and Zrnic. 2023a Science.
-
PPI++: Efficient Prediction-Powered Inference. (PPI++)
Angelopoulos, Duchi and Zrnic. 2023b arxiv.
-
Assumption-Lean and Data-Adaptive Post-Prediction Inference. (PSPA)
Miao, Miao, Wu, Zhao and Lu. 2023 arxiv.
-
Do We Really Even Need Data? 🦏
Hoffman, Salerno, Afiaz, Leek and McCormick. 2024 arxiv.
-
From Narratives to Numbers: Valid Inference Using Language Model Predictions from Verbal Autopsies (multiPPI++)
Fan, Visokay, Hoffman, Salerno, Liu, Leek and McCormick. 2024 COLM.
-
Code respository for the `ipd` package can be found here.